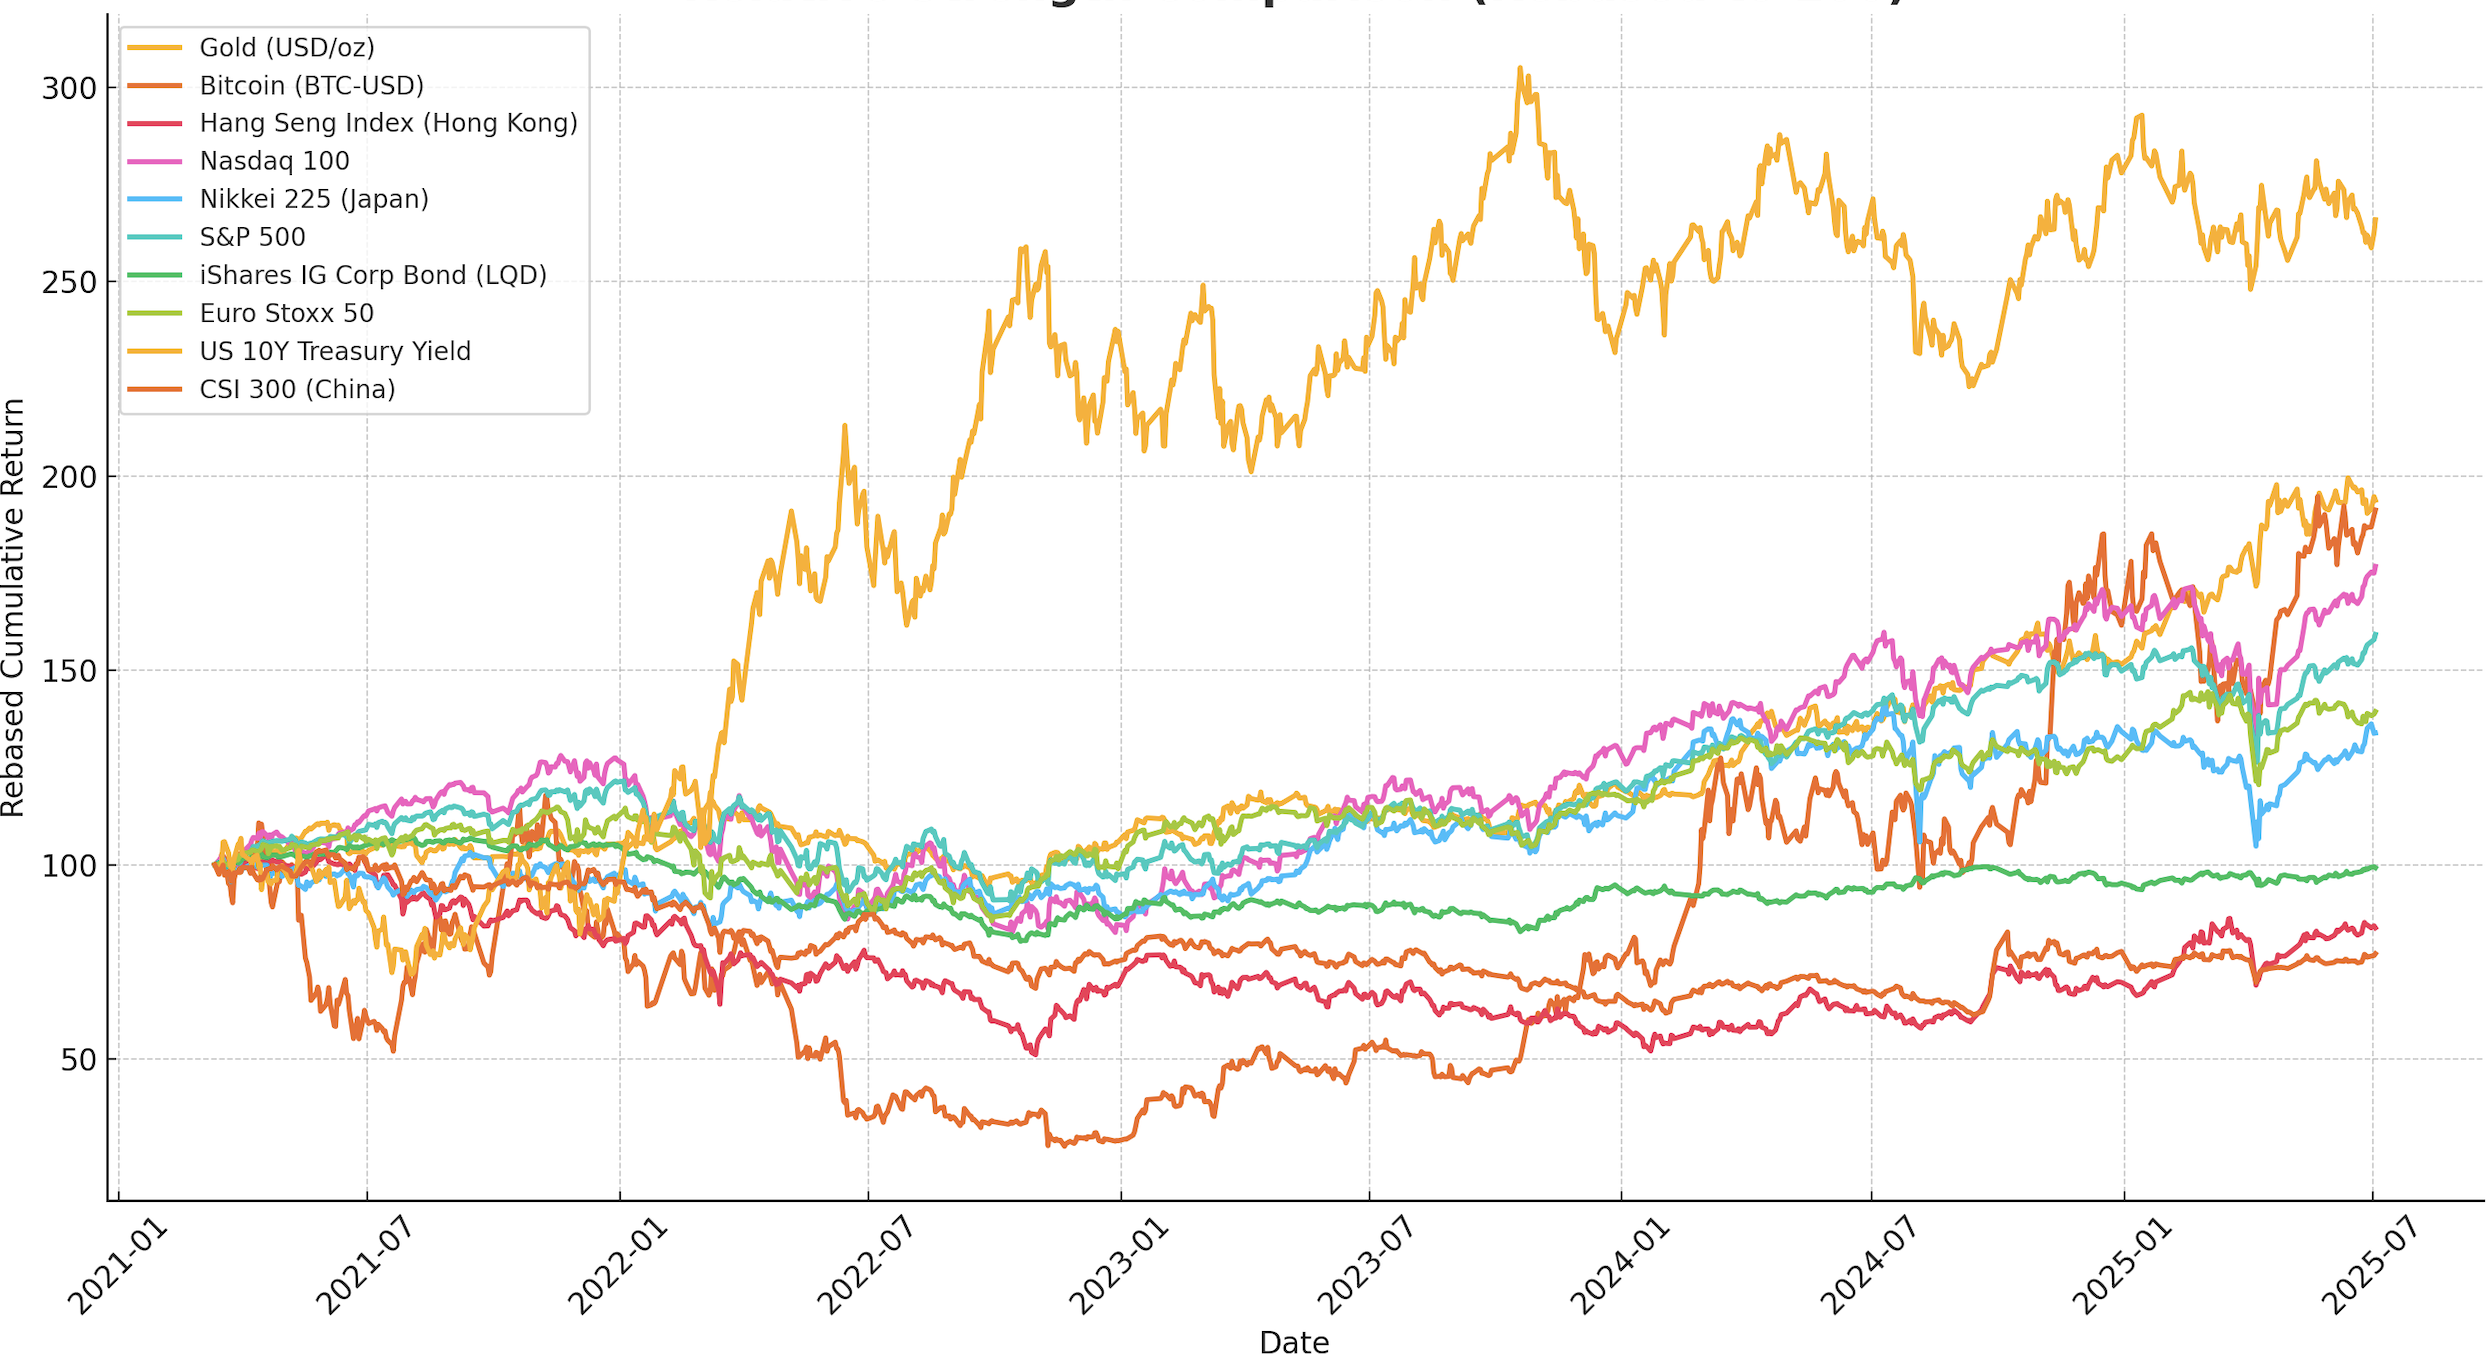
Correlation Matrix

Understanding relationships between major asset classes and indices

The table below shows the correlation coefficients between major asset classes and indices based on recent price movements. Values close to 1 indicate strong positive correlation, values close to -1 indicate strong negative correlation, and values near 0 indicate little or no correlation. Data is calculated using trailing 12 months of daily price data.

Correlation Strength Legend:

Perfect
Strong Positive (80-99%)
Moderate Positive (50-80%)
Weak Positive (20-50%)
Neutral
Weak Negative (-20% to -10%)
Strong Negative (-70% to -100%)
S&P 500 Nasdaq 100 Gold (USD/oz) US 10Y Treasury Yield Bitcoin (BTC-USD) Nikkei 225 (Japan)
S&P 5001.000.940.83-0.420.480.61
Nasdaq 1000.941.000.78-0.380.720.65
Gold (USD/oz)0.830.781.00-0.510.350.49
US 10Y Treasury Yield-0.42-0.38-0.511.000.12-0.15
Bitcoin (BTC-USD)0.480.720.350.121.000.28
Nikkei 225 (Japan)0.610.650.49-0.150.281.00

Correlation Matrix

Risk & Sharpe Ratio

Risk-adjusted performance metrics for major asset classes

The Sharpe ratio measures risk-adjusted return. A higher Sharpe ratio indicates better return per unit of risk. Max Drawdown shows the largest peak-to-trough decline, and VaR (Value at Risk) represents the potential loss at 95% confidence level. All metrics are calculated using 2 years of daily data for robust statistical analysis. Volatility is annualized from daily returns, Sharpe ratio uses a 2% risk-free rate, and VaR is calculated at 95% confidence level. Instruments are ranked by Sharpe ratio from highest to lowest.

Instrument 2Y Return (%) 2Y Volatility (%) 2Y Sharpe Ratio 2Y Max Drawdown (%) 2Y 95% VaR (%)
Gold (USD/oz) +95.7% 17.2% 1.97 -9.6% -1.6%
S&P 500 +67.3% 16.3% 1.49 -19.0% -1.4%
Nasdaq 100 +83.3% 20.7% 1.44 -22.9% -2.0%
STOXX Europe 50 +57.4% 17.7% 1.22 -16.1% -1.7%
Nikkei 225 (Japan) +45.2% 18.9% 0.96 -16.0% -1.8%
Bitcoin (BTC-USD) +227.1% 37.8% 0.83 -28.2% -3.6%
CSI 300 (China) +36.2% 26.7% 0.66 -33.9% -1.9%
iShares IG Corp Bond (LQD) +13.4% 7.4% 0.65 -7.6% -0.7%
Hang Seng Index (Hong Kong) +30.2% 22.2% 0.63 -25.3% -2.0%
US 10Y Treasury Yield +9.1% 14.1% 0.28 -17.1% -1.5%

Risk & Sharpe Ratio

Economic & Events Calendar

Stay informed of key upcoming economic events and data releases

Stay informed of key upcoming economic events and data releases that may impact global markets.

Date Time (GMT+8) Event/ Data Release Country Previous Consensus Impact
Mon 23rd Feb All Day China - Chinese New Year CN - - Holiday
Tue 24th Feb 23:00 CB Consumer Confidence (Feb) US 84.5 87.6 High
Wed 25th Feb 10:00 U.S. President Trump Speaks US - - High
Wed 25th Feb 18:00 CPI (YoY) (Jan) EU 1.7% 1.7% High
Wed 25th Feb 23:30 Crude Oil Inventories US -9.014M - High
Thu 26th Feb 21:30 Initial Jobless Claims US 206K 216K High
Fri 27th Feb 21:30 PPI (MoM) (Jan) US 0.5% 0.3% High
Fri 27th Feb 22:45 Chicago PMI (Feb) US 54.0 52.4 High

This week's focus is CB Consumer Confidence (Tue 24th), U.S. President Trump Speaks and EU CPI (Wed 25th), Initial Jobless Claims (Thu 26th), and PPI and Chicago PMI (Fri 27th). China markets are closed for Chinese New Year (Mon 23rd). All times in GMT+8.

Economic & Events Calendar

All Research Articles

Browse our complete collection of research reports and market analysis

Rebalancing with AI: Faster Cycles and Better Outcomes

Rebalancing with AI: Faster Cycles and Better Outcomes

Rebalancing keeps your portfolio aligned with your target allocation. With AI, you can rebalance faster, more precisely, and at lower cost. We explore how AI is transforming the rebalancing process.

How to Use AI to Reduce Portfolio Volatility

How to Use AI to Reduce Portfolio Volatility

Volatility can erode returns and test your discipline. AI now offers practical tools to identify risk, optimize allocation, and smooth the ride. We explore how to use AI to reduce portfolio volatility.

Rate Cuts 2026: A Wall Street Divide

Rate Cuts 2026: A Wall Street Divide

January 2026 CPI cooled to 2.4% YoY, supporting the case for mid-2026 rate cuts. Wall Street is sharply divided, from no cuts to 2 to 3 cuts. We examine implications for bond yields, duration, and cross-asset positioning.

Gold vs. Real Rates: The New Regime Trade

Gold vs. Real Rates: The New Regime Trade

Gold remains sensitive to real yields, but fiscal risk, geopolitics, and central‑bank demand are reshaping the regime. We map the drivers, risks, and portfolio implications.

Quality vs. Value Rotation Analysis

Quality vs. Value in a Late-Cycle Soft Landing

Late-cycle conditions reward balance-sheet strength and earnings durability. We assess the current valuation gap, what drives factor rotation, and why quality likely leads with tactical value opportunities around rate cuts.

US Earnings Breadth vs. Index Concentration

US Earnings Breadth vs. Index Concentration

Index performance remains dominated by a narrow leadership group. This report examines concentration risks, breadth signals like equal-weight performance, and the catalysts needed for earnings participation to broaden in 2026.

De-Dollarization Reality Check

De-Dollarization Reality Check: Erosion, Not Regime Change

The dollar remains the core of trade, reserves, and funding, but diversification at the margins is accelerating through gold purchases, local settlement, and regional payment rails. This report maps what is shifting, what is not, and where investors should watch for real change.

Small Caps vs. Mega Caps Analysis

Small Caps vs. Mega Caps: Valuation Gap and Catalysts

Small caps trade at a wide discount after years of lagging mega caps. This report reviews valuation spreads, rate sensitivity, credit conditions, and earnings breadth to identify catalysts that could drive a relative re-rating through 2026.

AI Infrastructure Investment Shift Analysis

The AI Infrastructure Investment Shift: From Hype to ROI

As AI markets mature in 2026, investors are shifting focus from broad AI enthusiasm to companies delivering measurable returns. This analysis examines the transition toward AI infrastructure investments in data collection, cloud applications, robotics, and memory technologies, providing strategic insights for navigating the evolving investment landscape.

Gold Surge to $5,000 Analysis

Gold Surge to $5,000: Geopolitical Hedging in 2026

Gold prices are surging in early 2026, with forecasts predicting a potential rise to $5,000 per ounce driven by escalating geopolitical volatility. This analysis examines the fundamental drivers behind gold's rally, including central bank buying and inflation concerns, and explores strategic portfolio allocation considerations for investors.

Fed Policy Pause Analysis

Fed Policy Pause: Navigating the January FOMC Meeting

The Federal Reserve is expected to pause its rate cutting cycle in January 2026, maintaining the federal funds rate at 3.50 to 3.75 percent before potential cuts in March and June. This analysis examines the Fed's neutral policy stance, economic data driving decisions, and strategic considerations for investors positioning portfolios.

ETF Frenzy Analysis

ETF Frenzy

This comprehensive analysis examines the current ETF market trends and investor behavior patterns. The article explores the implications of the growing ETF frenzy on market dynamics, liquidity, and traditional investment strategies, providing insights for both retail and institutional investors navigating this evolving landscape.

Are investors growing more realistic? Analysis

Are investors growing more realistic?

This analysis explores the evolving mindset of investors in today's market environment. The article examines whether recent market volatility and economic uncertainty have led to more realistic expectations and risk assessment among investors, and what this means for market behavior and investment strategies going forward.

USDJPY, End of the Carry Trade? Analysis

USDJPY, End of the Carry Trade?

This comprehensive analysis examines the USDJPY currency pair and explores whether the traditional carry trade strategy is reaching its end. The article analyzes the impact of shifting monetary policies, interest rate differentials, and market dynamics on the yen-dollar relationship, providing strategic insights for forex traders and investors.

Liquidity Mirage or Market Fuel? Analysis

Liquidity Mirage or Market Fuel?

This comprehensive analysis examines the current liquidity conditions in global markets and questions whether the apparent abundance of liquidity represents a sustainable foundation for market growth or a temporary mirage. The article explores the implications for asset prices, market stability, and investment strategies in an environment of uncertain monetary policy.

Markets are too quiet Analysis

Markets are too quiet

This analysis explores the current period of unusually low market volatility and what it might signal for future market movements. The article examines whether this calm represents complacency or a new market equilibrium, providing insights for investors navigating seemingly stable but potentially deceptive market conditions.

Rate Cuts 2026: A Wall Street Divide

Rate Cuts 2026: A Wall Street Divide

January 2026 CPI cooled to 2.4% YoY, supporting the case for mid-2026 rate cuts. Wall Street is sharply divided, from no cuts to 2 to 3 cuts. We examine implications for bond yields, duration, and cross-asset positioning.

Bond Market Reset Analysis

Bond Market Reset

This analysis examines the current state of global bond markets and explores whether we're witnessing a fundamental reset in fixed income valuations. The article analyzes the impact of changing interest rate environments, inflation expectations, and central bank policies on bond market dynamics and investment opportunities.

Iran-Israel Conflict Analysis

Iran-Israel Conflict: Market Implications

This comprehensive analysis examines the escalating tensions between Iran and Israel and their potential impact on global financial markets. The article explores how geopolitical risks could affect oil prices, regional markets, and global investment strategies, providing key insights for investors navigating uncertain geopolitical waters.

Commodity Surge Analysis

Commodity Surge

This comprehensive analysis examines the recent surge in commodity prices and its implications for global markets. The article explores the driving forces behind the commodity rally, including supply constraints, geopolitical tensions, and inflationary pressures, providing strategic insights for investors navigating the evolving commodity landscape.

Navigating US Equities Analysis

Navigating US Equities

The article highlights structured products as a strategic way to invest in U.S. equities during volatile markets and high interest rates. They offer capital protection with upside potential, but investors should be mindful of credit risk, liquidity, and complexity.

SPX vs SPW Analysis

SPX vs SPW

The article suggests that now may be a good time to invest in the S&P 500 Equal Weight Index (SPW), as the traditional S&P 500 (SPX) is overly reliant on a few overvalued tech giants. With the SPX/SPW ratio at extreme levels and signs of weakness in large-cap tech, SPW offers more balanced exposure and may outperform if market leadership shifts.

Market Volatility Insights Analysis

Market Volatility Insights

The article highlights that while the VIX is at its 2-year average, the elevated VVIX suggests investors are highly sensitive to potential risks. This means that despite stable headline volatility, markets are quick to react to news and economic developments, indicating underlying nervousness.